

San Antonio Housing Market Update: July 2026
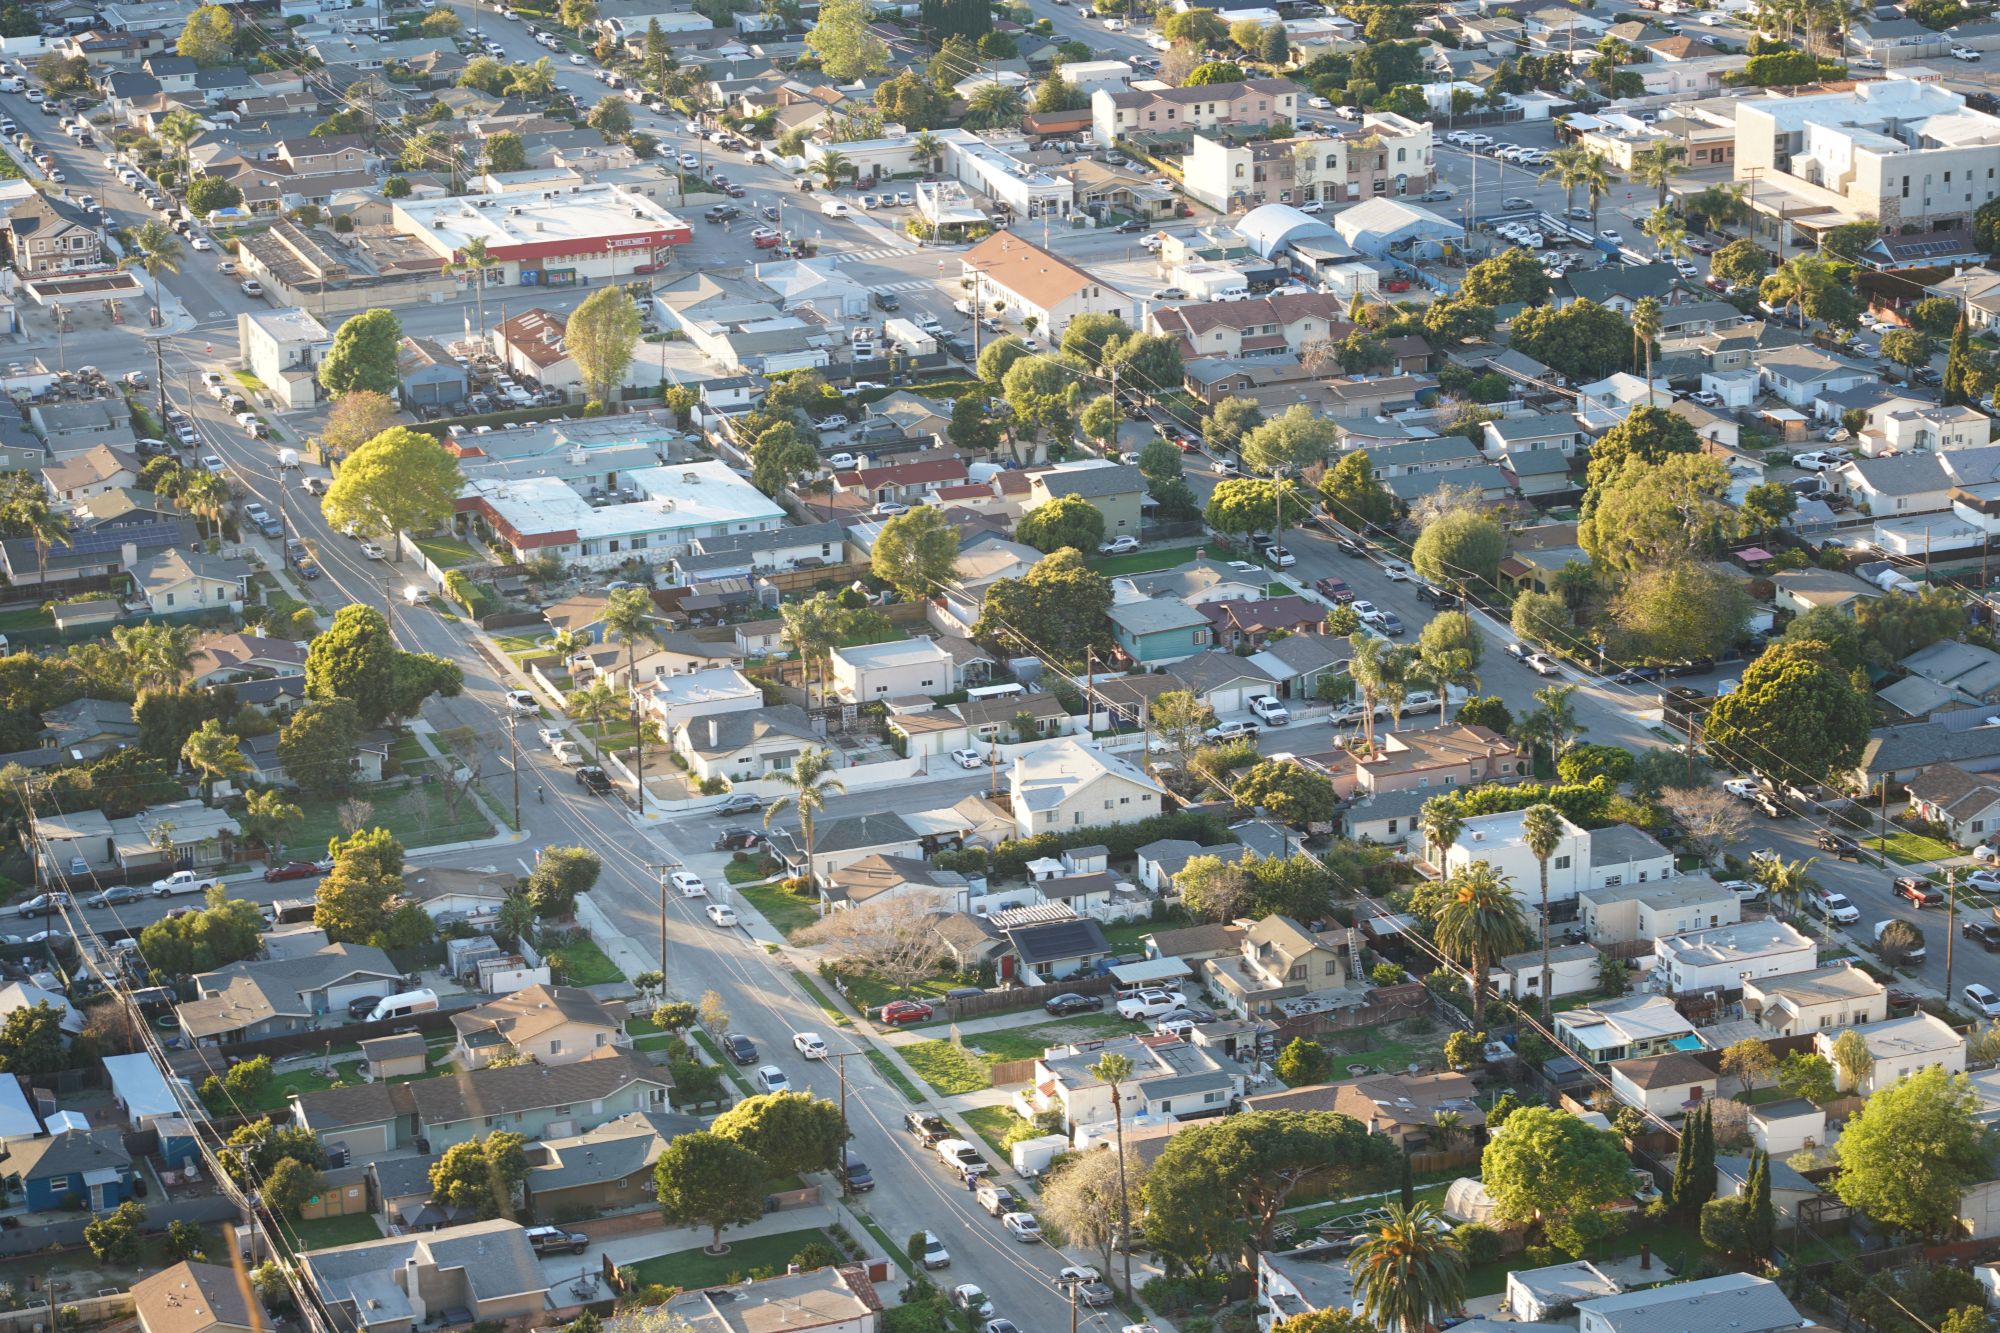
A San Antonio area neighborhood in summer, when buyers gained more inventory and negotiating room. Photo: Pexels.
You have been watching prices, refreshing listing apps, and wondering whether waiting another month helps or hurts you. That is the exact spot most buyers and sellers in the San Antonio housing market are sitting in this July, and the July 2026 numbers finally give you something firmer than a hunch to plan around.
I am Anthony Sharp, a U.S. Air Force veteran and REALTOR® with Sharp Realty Group here in Cibolo, and I read the monthly data the way I read a neighborhood, one street at a time. This month tells a clear story of more homes to choose from, steady prices, and real room to negotiate. Before you tour any of the San Antonio homes for sale, it helps to understand what shifted and what held firm.
Below I break down the July figures from the San Antonio Board of REALTORS, what they mean for buyers, sellers, investors, and the military families I work with along the Joint Base San Antonio (JBSA) corridor, and how I would use each number if we were mapping your next move together.
Key Takeaways
- Sales rose 5% year over year in July, with 3,328 homes sold, so buyer demand held up even with rates in the high 6s.
- Inventory sat at 6.11 months and active listings hit 17,567, giving buyers more choice and more negotiating room.
- The median price rose 2% to $315,000 and homes averaged 81 days on market, so pricing right matters more than ever for sellers.
- Homes sold for about 93% of original list price, which means offers below asking are getting accepted again.
What the July 2026 San Antonio Numbers Say
The headline from the San Antonio Board of REALTORS (SABOR) is a market that is busy without being frantic. Here is how the core figures line up and what each one signals:
Sales Volume and Buyer Demand
A total of 3,328 homes sold across the San Antonio area in July, a 5% increase over July 2025, according to the monthly SABOR market report. That is a meaningful jump when you remember the 30-year fixed mortgage was averaging 6.67% as of August 13, 2026, according to Freddie Mac. Buyers are not sitting on their hands waiting for a magic rate. They are adjusting, negotiating, and closing. Pending sales did come in lower at 2,554, down 13% year over year, so the pipeline for the next month or two looks a touch lighter than the closings that just cleared. I read that gap as a timing quirk more than a warning, since a strong month of closings often follows a slower stretch of contracts written earlier in the summer.
Prices and Price per Square Foot
The median sale price rose 2% year over year to $315,000, while the average price climbed 3% to $388,070. Price per square foot held flat at $176. I read that combination as stability, not a boom and not a bust. Values are inching up on modest volume, which is the kind of market where a well-priced home still moves and an overpriced one sits. For anyone worried about buying at a peak or selling into a slide, this month points to neither.
The gap between the median and the average is worth understanding too. The median is the middle sale, so it shrugs off a handful of high-dollar closings, while the average gets pulled upward by them. When the average sits well above the median, as it does this month, it usually tells me the upper end of the market is still transacting even as the typical home settles closer to that $315,000 middle. That is why I steer clients to comparable sales in their own price band and neighborhood rather than a citywide headline, because the number that matters is the one for homes like yours.
Days on Market and List-to-Sale Ratio
Homes averaged 81 days on the market in July, an 11% increase from a year ago, and sold for about 93% of their original list price. Those two numbers travel together. Homes are taking longer to sell, and sellers are accepting less than they first asked. That is a normal, healthier pace than the multiple-offer sprints of a few years back, and it hands patient buyers time to inspect, compare, and negotiate without panic.
Why Rising Inventory Favors San Antonio Buyers Right Now
With more than six months of inventory, San Antonio buyers had more listings to weigh and more time to decide. Photo: Pexels.
The single biggest shift this year is supply, and July made it plain. When a market carries more than six months of inventory, the leverage tilts toward the person writing the offer. Here is where that shows up:
Months of Inventory and Active Listings
Inventory measured 6.11 months in July, with 17,567 active listings, up 3% year over year. Months of inventory is the figure I watch most closely, because it captures the balance of supply and demand in one number. It answers a simple question about how long it would take to sell every home on the market at the current sales pace if no new ones came on. Housing economists often treat roughly six months as the line between a buyer's and a seller's market, so San Antonio is now sitting just on the buyer-friendly side of balanced. More homes on the market means you are less likely to be forced into a bidding war and more likely to find a property that fits without overpaying to win it.
New Listings and Negotiating Room
New listings totaled 4,767 in July, a 4% dip from last year, so the fresh supply is steady rather than flooding in. Combined with that 93% list-to-sale ratio, the practical upshot is that reasonable offers below asking are landing. When I sit with a buyer in this market, we are no longer bracing for ten competing bids. We are studying how long a home has been listed, what similar homes closed at, and where the seller might have room to move on price, repairs, or closing costs.
Price Distribution and the Middle Market
July sales were heavily concentrated in the middle of the market, which is worth knowing before you set a budget or a list price. The distribution looked like this:
- About 13.72% of sales closed at $199,999 or below.
- About 67.48% of sales closed between $200,000 and $499,999.
- About 11.98% of sales closed between $500,000 and $749,999.
- About 6.82% of sales closed at $750,000 and above.
More than two-thirds of the market cleared between $200,000 and $500,000, which is squarely where most first-time buyers and relocating military families shop. That depth of activity in the middle band is why homes in that range still move at a fair pace when they are priced to the current data rather than to last year's optimism.
What the July Data Means for Sellers in the San Antonio Market
If you are selling, this month is not a reason to panic, but it is a reason to be honest with yourself about price and preparation. The market rewards realism right now:
Pricing to the Current Data
With homes averaging 81 days on the market and selling at about 93% of the original list price, the cost of overpricing is measured in weeks and price cuts. A home that launches too high tends to sit, go stale, and eventually sell for less than it would have with an accurate number from day one. I would rather price a client at the level the recent comparable sales support and let the home draw genuine interest than chase the market down with a series of reductions.
Standing Out Among More Choices
When buyers have 17,567 active listings to weigh, presentation stops being optional. Clean, decluttered, well-photographed homes with a move-in-ready feel are the ones that get the second showing. Small repairs handled before listing, a pre-listing walkthrough of the obvious inspection items, and a fair price together do more than any single gimmick. Buyers in a balanced market are comparing your home directly against several others in the same price band, so give them fewer reasons to keep scrolling.
Using Concessions Instead of Price Cuts
In a market where buyers have leverage, a targeted concession can be sharper than a straight price drop. Offering to cover part of a buyer's closing costs or fund a rate buydown can lower their monthly payment in a way that gets a hesitant buyer off the fence, sometimes for less total cost to you than slicing the price. Which lever works depends on your buyer and your equity position, so it is worth running both scenarios before you decide. Talk with your agent and, for the tax side, a qualified professional about how any concession affects your net.
I saw this play out with a seller in the corridor earlier this year. Their home had been listed a few weeks with steady showings but no offer, and the instinct was to knock $10,000 off the price. Instead we held the number and advertised a credit the buyer could apply to a rate buydown or closing costs. The offer that came in used the credit to bring the payment down to where the buyer was comfortable, and the seller netted more than the price cut would have left them. That will not be the right answer for every listing, but in a payment-sensitive market it is a tool too many sellers overlook.
Reading July Through a Buyer, Investor, and Military Lens
Steady prices and longer days on market gave investors and PCS buyers more time to underwrite a deal. Photo: Pexels.
The same July report reads differently depending on why you are in the market. Here is how I frame this month for each of the buyers I work with most:
First-Time and Move-Up Buyers
A $315,000 median price and a market clustered between $200,000 and $500,000 mean the typical San Antonio home is within reach for a lot of first-time buyers, especially with the extra inventory and negotiating room this summer. The trade-off is the rate. At 6.67%, your monthly payment is higher than it would have been three years ago, so the smart play is to get a real preapproval, know your comfortable payment including taxes and insurance, and let a modest below-asking offer do some of the work. The 93% list-to-sale figure is your friend here, since it tells you that opening a few percent under asking is normal right now, not insulting. Before you narrow the corridor down to one town, the trade-offs between Schertz and Cibolo come down to commute, lot size, and price per square foot.
Investors and Rental Owners
As someone who self-manages rental properties, I read the rental line in this report closely. SABOR counted 4,963 active rental listings in July, up 5% year over year, with an average monthly rent of $1,877. Longer days on market and steadier prices give investors more time to underwrite a purchase without the pressure of a bidding war, which is a welcome change from a few years ago. The math still has to work on day one though, so I tell every investor to budget for taxes, insurance, vacancy, and repairs rather than banking on fast appreciation. Before you run the numbers on a rental near a base, it helps to know how JBSA-area landlord deals pencil out when military demand recycles every move season.
Military and PCS Buyers Near JBSA
For families reporting to JBSA on orders, July's mix of more inventory and softer negotiating dynamics helps when your timeline is tight. A zero-down U.S. Department of Veterans Affairs (VA) loan pairs well with a market where sellers are open to covering closing costs or a rate buydown, since VA rules let them contribute toward those costs. The longer 81-day average also means you are less likely to lose a home the day it lists, which matters when you are house-hunting on a compressed permanent change of station schedule. I spent years in uniform, and I know the difference between closing on time and scrambling the week your household goods arrive, so I build the timeline backward from your report date.
How July Fits the Wider Texas Housing Picture
San Antonio does not move in a vacuum, and the statewide numbers give useful context for where our metro sits:
San Antonio and the Statewide Picture
Across Texas, 30,219 homes sold in July, a 0.9% year-over-year increase, with a statewide median of $345,000 and an average price of $441,672. San Antonio's 5% sales gain outpaced the state's flatter volume, while our $315,000 median sits below the Texas median. Put simply, our metro is more affordable than the state average and saw stronger buyer activity this month, which is part of why the JBSA corridor keeps drawing relocating families looking for more house per dollar.
Rates and the Road Into Fall
Mortgage rates have hovered in the high 6s through the summer, easing slightly to 6.67% by mid-August after touching higher earlier in the season. Nobody can promise where rates head next, and small moves change monthly payments more than most buyers expect. If rates ease further into the fall, the lighter pending-sales figure from July could firm back up as sidelined buyers return. If they climb, the extra inventory and negotiating room we are seeing now may matter even more. Either way, the current window gives buyers choice and sellers a clear signal to price with discipline. Rates and figures here are a general guide and change weekly, so confirm current numbers with a licensed lender before you plan around them.
Making Your Move With July's Numbers in Hand
The uncertainty that had you refreshing listing apps should feel a little quieter now. You are not staring at a runaway market or a collapsing one. You are looking at a San Antonio market with more homes to choose from, prices holding steady, and sellers who are willing to negotiate, which is a setup where a prepared buyer or a realistically priced seller can act with confidence rather than fear.
Whether you are buying your first home, listing one you have outgrown, adding a rental, or landing on PCS orders, the July data points to the same move, which is to get your financing and your number right, then act on the choice and leverage this market is handing you. That clarity is exactly what one month of clean data is supposed to buy you, and it is the position I want every client to be in before they sign anything.
Ready to Turn These Numbers Into Your Next Move?
I am Anthony Sharp with Sharp Realty Group, a U.S. Air Force veteran and military relocation specialist who helps buyers, sellers, investors, and JBSA families read the San Antonio market and act on it with a clear plan. If you want to know what this month means for your specific home, budget, or timeline, let's talk.
Call or text: 210-997-0763
Schedule a time: book a consultation
Email: anthony@sharprealtygrouptx.com
Office: 213 Terramar, Cibolo, TX 78108
Frequently Asked Questions (FAQs)
Is July 2026 a buyer's or seller's market in San Antonio?
July sat just on the buyer-friendly side of balanced. Inventory measured 6.11 months, which is right around the line economists use to separate the two, and homes sold for about 93% of original list price. Buyers have more choice and negotiating room than they did a few years ago, while sellers who price to the current data and prepare their homes still sell at a fair pace.
What is the median home price in San Antonio right now?
The median sale price in July 2026 was $315,000, up 2% from a year earlier, and the average price was $388,070. Price per square foot held flat at $176. Medians move month to month and vary by neighborhood and price band, so treat any single figure as a snapshot and look at recent comparable sales for the specific area you are considering.
How long are San Antonio homes taking to sell?
Homes averaged 81 days on the market in July, an 11% increase over the prior year. That longer timeline gives buyers room to inspect and negotiate, and it is a reminder for sellers that an accurate list price from day one usually beats starting high and cutting later. Well-priced, well-presented homes still move faster than the average.
Are mortgage rates hurting the San Antonio market?
Rates in the high 6s have not stopped buyers. Sales still rose 5% year over year in July even with the 30-year fixed averaging 6.67% by mid-August. Higher rates do raise monthly payments, so many buyers are negotiating seller concessions or rate buydowns to ease the cost. A licensed lender can price your exact rate and show how a buydown would change your payment.
Is now a good time to buy near JBSA on a VA loan?
For many military buyers, the current mix of more inventory and seller flexibility is a reasonable window. A zero-down VA loan pairs well with a market where sellers may cover closing costs or a rate buydown, and the longer days on market ease the pressure of a tight PCS timeline. The right move still depends on your budget, your report date, and your financing, so line those up with a VA-savvy lender first.
How does San Antonio compare to the rest of Texas this month?
San Antonio's 5% sales increase outpaced the statewide gain of 0.9% in July, and our $315,000 median sits below the Texas median of $345,000. That combination of stronger local activity and lower prices is part of what keeps drawing relocating and military families to the metro and the JBSA corridor in search of more home for the money.
* * *
Disclaimer: This article is general information only and does not consider your individual financial, tax, or legal circumstances. Market data, mortgage rates, and program terms change and are provided as a general guide, not a guarantee. Nothing here guarantees financing, approval, appreciation, or resale value. Before making a decision, speak with a qualified professional such as a REALTOR®, a licensed lender, or an attorney about your specific situation.
Categories
- All Blogs (262)
- BAH (3)
- For Home Buyers (181)
- For Home Sellers (88)
- For Investors (41)
- For Military Service Members (174)
- For Renters (9)
- JBSA (6)
- Local Events (12)
- Local Real Estate News (38)
- Market Updates (41)
- Military Relocation (40)
- Neighborhood Tours (57)
- PCS Move (105)
- Property Tours (5)
- VA Loans (10)
Recent Posts